To some, I’m sure it’s fair to say the first two months into 2022 have been eventful in one way or another. If I was as dedicated of a writer as, I guess I could be, this would be my third post since Dec.2021; either I lack the dedication, or I dissent from those who are taken by surprise over the chaos we’ve yet to see. Regardless, there’s more than a few things to reflect on! First of all, Merry (late) Christmas & Happy belated New Years. Despite the anticipation of Fed rate hikes in the upcoming month(s) for the first time since 2018, let’s take a step back in time. Since the recent provisions of a global-arms-race (“tangible nuclear threat”, for short) we now face is as fresh as the last HOMYF episode, let’s go back a biiiiiiittt further. Forget about the -50% haircut in Russia’s stock market, & think back to a time before “the worst start to a trading year for the S&P in nearly a century”, OK? — Keep going. Before “Emergency meeting(s)” between the Federal Reserve / NATO / UN / & WH Briefings became regularly scheduled events, before $100 oil, before New York’s peak of Omicron cases, before Betty White was laid to rest (RIP), we really did have everything, didn’t we?
If you’re a glass half full type of person — the world hasn’t stopped spinning. It spun before The Great Depression & WWII, it spun during the Global Financial Crisis, COVID 2020, & its spun ever since December 15th, 2021. Even if a “planet killer” sized asteroid was destined to obliterate our value of times & times of value, the same goes. Sure, reality as you know it comes to an un-deniable standstill; but apparently, as long as both eyes are closed, that glass is as full as you see it to be. Right?
Excuse my excuses, but, I dealt with the same writer’s block I had one month ago (Jan.25.2022) before deciding to say “F* it, I’m not doing this mid-week HW”. Now that we’re here, I’d like to cover some lost ground.


As much as I appreciate the perspectives of those who see market internals in aspects different than my own, I appreciate the “bigger picture” much more; a movie is only as good as its ending. Since we’re nowhere near the end of this one, it’s best for those who’ve been violated by the market already to further refrain from being a nuisance to the rest watching. There’s more to the market than what meets the naked eye — even less of which is fully comprehensible through data alone. Late January (24th-28th, specifically) is an important period to acknowledge. Besides the seemingly over-scheduled fed meetings resonating with (yet another) extreme/oversold/lowest/break of:
{INSERT TECHNICAL INDICATOR HERE}, there was much more (or, less?) to major indicies than I know how to explain myself.

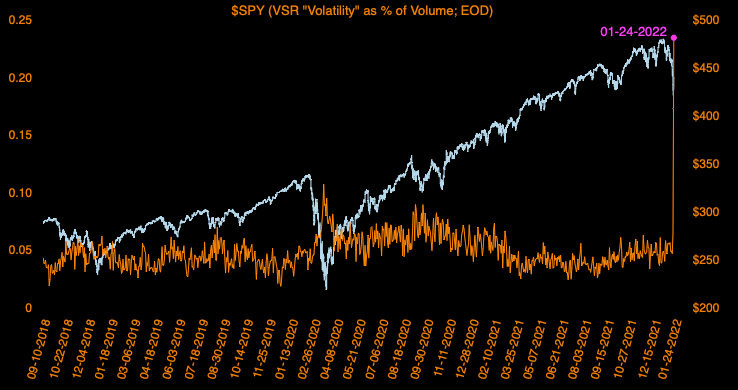
Now, I’m the furthest thing from an “expert” on Fed policy. Not only that, but even the topic fails to guide (or mis-guide) my perspective of market internals entirely. Although correlation may not inherit causation, this is the second (would be #3) time since 12/15/2021 having to emphasize the disparity of a healthy market vs. the shit show US indices have turned into. Since (if you remembered) 12/15/2021 was the Fed’s most recent meeting deciding 2022 rate hikes, it truly begs the question of whether or not this is a coincidence, or a flagrant attempt to save the market by apparently killing it first. Things get a little fucky starting Jan.24.2022- keep that “record # of shares traded by SPY & QQQ” tweet in mind.


All three pictures, clearly indicative of massive volatility. “VSR” being the ratio of intra-day (avg) volume to the cumulative flow that drives price movement (Intra-day AvgVolume / volume taken to drive price $.01). Without going too much into detail, a low “Qratio” insinuates higher volume than average, while a low “sneakR” higher volatilitythan is needed to suffice the volume driven from it. In all 3 examples above, their values are all derived from volume. Despite the obvious spike in volatility (“VSR”), the EXTREME lows in only 2/3 examples beg the question: Why the divergence? Even on a normalized basis (indexing volume / VSR)- does peak-COVID 2020 do what we’re seeing, justice?